Investing in gold might seem simple at first glance, but if you want to increase your profit potential while minimizing risk, one essential tool you shouldn't overlook is reading gold price charts. These charts help you identify trends and plan your trades more systematically.
This article will guide you through how to read gold price charts, with a focus on candlestick charts—one of the most fundamental chart types that beginners should start practicing with. Plus, we'll introduce 3 essential steps to start trading gold effectively.
How to Read Gold Price Charts: The Basics You Need to Know
If you want to start analyzing gold prices, the first thing you should learn is how to read real-time gold price charts. These charts provide a clear overview of price movements over different time periods, helping you make more informed decisions.
Key elements to pay attention to on the chart include:
Time Frame
For example, if you choose to view a 15-minute gold chart, each candlestick on the chart will represent the price movement within that specific 15-minute period.

Candlestick Charts
Candlestick charts are one of the most popular chart types used by traders because they are easy to read and quickly convey key information. A green candlestick indicates that the closing price was higher than the opening price (meaning the price went up), while a red candlestick shows that the closing price was lower than the opening price (meaning the price went down).

Price Axis (Vertical) and Time Axis (Horizontal)
The vertical axis shows the price levels of gold, typically quoted as price per ounce in US dollars. The horizontal axis represents the time period, such as date, hour, or minute. These axes help you visualize when the price is trending upward or downward during specific time frames.

Key Data: Open, High, Low, Close (OHLC)
These are the essential data points for each time period: the opening price, the highest price, the lowest price, and the closing price. This information forms the foundation of technical analysis for gold price charts, helping traders assess market behavior within each selected timeframe.


How to Read Gold Charts Using Candlestick Charts
Candlestick charts are the most popular tool among gold investors because they are easy to understand, provide a clear visual of price movements, and help identify buying and selling pressure during each time period.
Key characteristics of candlesticks include:
- Long Candlesticks indicate strong buying or selling pressure. A long green candle shows aggressive buying, while a long red candle reflects heavy selling.

- Short Candlesticks indicate a slowdown in momentum or market indecision. They suggest that neither buyers nor sellers are in strong control during that period, often signaling a pause or potential reversal in the trend.

- Long Wicks (Shadows) indicate that buyers or sellers attempted to push the price strongly in one direction, but failed to maintain that level by the close of the period. This often reflects market rejection of higher or lower prices, signaling potential reversals or weak momentum.

Must-Know Candlestick Patterns
- Doji: Signals market indecision and can indicate a potential reversal point. The opening and closing prices are very close, forming a cross or plus sign.
- Hammer and Inverted Hammer: Indicate a possible reversal from a downtrend to an uptrend. A Hammer has a long lower wick, while an Inverted Hammer has a long upper wick.
- Hanging Man: A bearish reversal pattern that appears after an uptrend, signaling potential downward movement. It looks similar to a Hammer but occurs at the top of an uptrend.
- Bullish & Bearish Engulfing: Powerful reversal patterns. A Bullish Engulfing pattern signals a possible shift from downtrend to uptrend, while a Bearish Engulfing pattern indicates a potential shift from uptrend to downtrend. These patterns occur when a larger candle fully engulfs the previous candle.
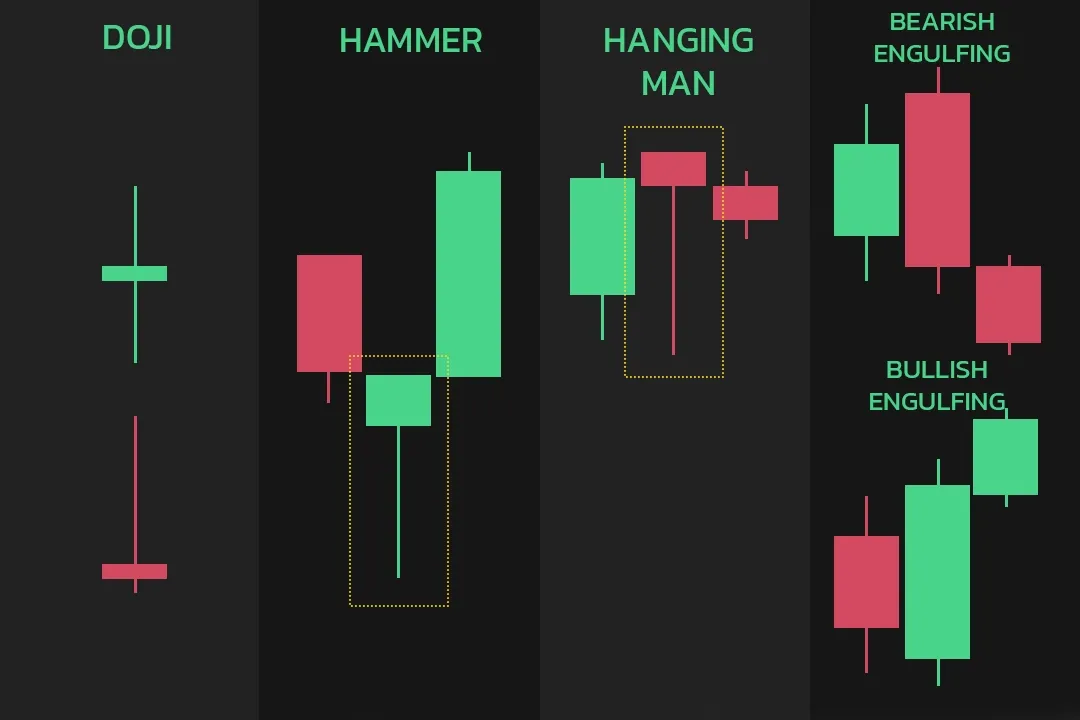
When reading candlestick charts, it's important to analyze multiple candles in sequence and compare them with trading volume.
|
|
Tip: Look for long candlesticks near key support or resistance levels, as they often signal strong buying or selling interest in gold. |

3 Steps to Start Trading Gold with Confidence
Want to start trading gold but not sure where to begin? Don't worry—just follow these 3 simple steps to help you get started with confidence and reduce unnecessary mistakes.
Choose the Right Broker for You
Before jumping into gold trading, it's crucial to select a broker that fits your trading style. Look for a reliable, user-friendly platform that supports various gold trading options and, most importantly, offers comprehensive charting and analysis tools. This will help you plan your trades more effectively.
Find the Best Trading Hours Before You Enter the Market
Timing is a key factor in gold trading. Periods of high volatility—such as during major economic data releases or when European and U.S. markets are open—often provide the best opportunities to capture profits. Keep an eye on these windows for optimal trading chances.
Practice Your Strategy Before Going Live
Don't rush into a live trading account right away. Start with a demo account first to practice reading candlestick charts, develop your strategy, and test different trading methods until you're confident. Once you feel ready, you can move to live trading—this way, you minimize risk and boost your chances of success.
Using charts in trading is crucial for investors to analyze and make accurate decisions. A fast and stable platform that can display real-time price charts is essential.
At IUX, we offer a charting system designed to help traders clearly see market trends, with fast and precise chart rendering at every moment—enabling more confident buy and sell decisions.
Start trading with IUX today and take your trading journey to the next level.
|
|

|
|
Tip: Always confirm candlestick signals with the overall trend and market news before placing a gold trade. |
Analyzing gold price charts using candlestick patterns is a key tool that helps you understand buying and selling pressure in the gold market. It allows you to identify trends and spot more precise entry and exit points.
However, candlestick analysis should not be used in isolation. For well-rounded decision-making, it's important to also consider fundamental factors such as interest rates, inflation, oil prices, and the strength of the US dollar.
By combining technical and fundamental analysis, you can become a gold investor with both a smart strategy and the confidence to trade effectively.
💡FAQs
Q: Why are candlestick charts better than line charts for gold trading?
A: Candlestick charts show more detailed price information, including open, high, low, and close, which helps traders understand market sentiment and identify reversals more accurately than simple line charts.
Q: Which time frame is best for beginners to read gold charts?
A: Many beginners start with 15-minute, 1-hour, or 4-hour charts because they balance short-term price movement with clearer trend visibility, making patterns easier to spot.
Q: Can candlestick patterns alone guarantee profitable gold trades?
A: No. Candlestick patterns are powerful tools, but they should be combined with trend analysis, support and resistance, and fundamental factors like interest rates and inflation for better accuracy.
|
|
|
|


Note: This article is intended for preliminary educational purposes only and is not intended to provide investment guidance. Investors should conduct further research before making investment decisions.
Source: understanding the dynamics behind gold prices , understanding basic candlestick charts